Pages

Showing posts with label engine. Show all posts

Wednesday, August 24, 2016

Using Kinect with Unity 3D Game Engine

How to use the Kinect (Microsoft Drivers v. 1.5) with Unity 3D

Here is my current result for fun (The beginning is my own C++ version that doesnt involve unity) in a game where you can throw fireballs:


After spending a while developing a little C++ library to use with the Microsoft Kinect Drivers (which Ive been meaning to release), I decided to try to integrate the Kinect functionality into the popular Unity 3D Game Development software.

I was pretty excited after finding the handy CMU package here. However, it only worked with the beta Microsoft SDK and didnt have some of the more advanced functionality that I needed. Im running version 1.5 hacked together a quick DLL and modified some code.

I use the Microsoft Kinect SDK Version 1.5 which I have available for download here.

The DLL source code can be found here in case you want to modify it for a different version.

The DLL itself (needed for the Kinect to work with Unity) can be found here and should be placed in your Microsoft SDK/Kinect folder like below:
C:Program FilesMicrosoft SDKsKinectv1.5AssembliesUnity

The scripts to control a player and receive information from the Kinect can be found here.

They are used the same way as the CMU ones but are slightly modified with a bit more error checking and some extra flags. All you have to do is follow the same instructions on the CMU page linked above which just involves enabling the Kinect and telling the KinectModelControllerV2 where your joints are. The movement flag is still in beta as Im trying to make it so the character can walk around.

I have a version that is entirely in C++ using OpenGL, FreeGlut, my own version of Blepo, and my own development libraries that is previewed in the beginning of the video that can be found here. It is what I do most of my testing in before I port it over to Unity.

Enjoy!

Consider donating to further my tinkering.


Places you can find me
Read More..

Monday, July 11, 2016

Berkeley Earth Maps Powered by Google Maps Engine now available in the Google Maps Gallery


Google Maps is a familiar and versatile tool for exploring the world, but adding new data on top of Google Maps has traditionally required expending effort for both data management and website scripting. Google recently expanded Google Maps Engine and debuted an updated Google Maps Gallery. These tools aim to make it easier for users and organizations to integrate their geographic data with Google Maps and share it with the world. At Berkeley Earth we had an early opportunity to work with these new tools.

The use of Google Maps Engine eliminates the need for users to run their own map-serving Web servers. Maps Engine also handles mundane mapping tasks, such as automatically converting georeferenced image files into beautiful map layers that can be viewed in Google Maps, no programming required.


Annual average land-surface temperature during the period 1951-1980 as estimated by Berkeley Earth.

Similarly, one can take tables of location data and map them onto a Google Map using geographic markers and popup message boxes that make it easy to explore georeferenced information.


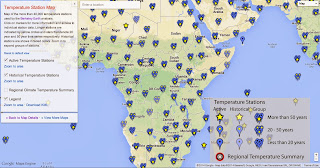
Map of the more than 40,000 temperature stations used by the Berkeley Earth analysis. On the left is part of the original table of data. On the right is its representation in Google Maps Engine.

When mapping locations, the new Maps Engine tools allows users to upload their own geographic markers or chose from Google’s many selections; the geographic marker icons used in the temperature station map above were uploaded by us. Alternatively, we could have used one of the stock icons provided by Maps Engine. In addition, users can customize the content and appearance of the popup message boxes by using HTML. If the georeferenced data can be linked the web addresses of already existing online content, one can also incorporate images or outgoing links within the message boxes, helping the user find more information about the content presented in the map.

The ease of putting image layers into the new Maps Engine has allowed Berkeley Earth to create and share many scalable maps of climate and weather information that are fun to explore. Incorporating these maps in our website and posting them on the Google Maps Gallery provides the public with a new tool to help locate local weather stations, learn about local climate, and download various kinds of weather and climate data.

Now, anyone can easily learn about both the weather in their city and the climate of the entire globe from a single, simple interface. Google Maps Engine and the new Maps Gallery has allowed us to bring the story of climate to a broad audience in a way that can be easily understood.
Read More..

Thursday, July 7, 2016

Map of Life A preview of how to evaluate species conservation with Google Earth Engine


Nature reserves have a vital role for protecting biodiversity and its many functions. However, there is often insufficient information available to determine where to most effectively invest conservation efforts to prevent future extinctions, or which species may be left out of conservation actions entirely.

To help address these issues, Map of Life, in collaboration with Google Earth Engine, has now pre-released a new service to pinpoint at-risk species and where in the world that they occur. At the fingertips of regional naturalists, conservation groups, resource managers and global threat assessors, the tool has the potential to help identify and close key information gaps and highlight species of greatest concern.

Take the Tamaulipas Pygmy Owl, one of the smallest owls in the world that is restricted to highland forests in Mexico. The consensus range map for the species indicates a broad distribution of over 50,000 km2:
Left: Tamaulipas Pygmy Owl (Glaucidium sanchezi, photo credit: Adam Kent). Right: Map of Life consensus range map showing the potentially habitable range of this species.

But accounting for available habitat in the area using remotely sensed information presents a different picture: less than 10% of this range are forested and at the suitable elevation.
Users can change the habitat association settings and explore on-the-fly how this affects the distribution and map quality. This refined range map now allows a much improved evaluation of the owl’s potential protection. Furthermore, the sensitivity of conservation assessments to various assumptions can be directly explored in this tool.
The owl’s potential protection is likely to occur in only around 1,000 km2 that are under formal protection, representing seven reserves of which only two have greater than 100 km2 area. This is much less than would be desirable for a species with this small a global range.

Another species example, the Hildegard’s Tomb Bat, is similarly concerning: less than 6,000 km2 of suitable range remains for this forest specialist in East Africa, with less than half currently under protection.

A demonstration of this tool for 15 example species was pre-released at the decadal World Parks Congress in Sydney Australia last November to the global community of conservation scientists and practitioners. In the coming months this interactive evaluation will be expanded to thousands more species, providing a valuable resource to aid in global conservation efforts. For more information and updates, follow Map of Life.
Read More..

Tuesday, July 5, 2016

See through the clouds with Earth Engine and Sentinel 1 Data


This year the Google Earth Engine team attended the European Geosciences Union General Assembly meeting in Vienna, Austria to engage with a number of European geoscientific partners. This was just the first of a series of European summits the team has attended over the past few months, including, most recently, the IEEE Geoscience and Remote Sensing Society meeting held last week in Milan, Italy.
Noel Gorelick presenting Google Earth Engine at EGU 2015.
We are very excited to be collaborating with many European scientists from esteemed institutions such as the European Commission Joint Research Centre, Wageningen University, and University of Pavia. These researchers are utilizing the Earth Engine geospatial analysis platform to address issues of global importance in areas such as food security, deforestation detection, urban settlement detection, and freshwater availability.

Thanks to the enlightened free and open data policy of the European Commission and European Space Agency, we are pleased to announce the availability of Copernicus Sentinel-1 data through Earth Engine for visualization and analysis. Sentinel-1, a radar imaging satellite with the ability to see through clouds, is the first of at least 6 Copernicus satellites going up in the next 6 years.
Sentinel-1 data visualized using Earth Engine, showing Vienna (left) and Milan (right).
Wind farms seen off the Eastern coast of England.
This radar data offers a powerful complement to other optical and thermal data from satellites like Landsat, that are already available in the Earth Engine public data catalog. If you are a geoscientist interested in accessing and analyzing the newly available EC/ESA Sentinel-1 data, or anything else in our multi-petabyte data catalog, please sign up for Google Earth Engine.

We look forward to further engagements with the European research community and are excited to see what the world will do with the data from the European Unions Copernicus program satellites.
Read More..

Wednesday, February 10, 2016

Google Flu Trends gets a brand new engine


Each year the flu kills thousands of people and affects millions around the world. So it’s important that public health officials and health professionals learn about outbreaks as quickly as possible. In 2008 we launched Google Flu Trends in the U.S., using aggregate web searches to indicate when and where influenza was striking in real time. These models nicely complement other survey systems—they’re more fine-grained geographically, and they’re typically more immediate, up to 1-2 weeks ahead of traditional methods such as the CDC’s official reports. They can also be incredibly helpful for countries that don’t have official flu tracking. Since launching, we’ve expanded Flu Trends to cover 29 countries, and launched Dengue Trends in 10 countries.

The original model performed surprisingly well despite its simplicity. It was retrained just once per year, and typically used only the 50 to 300 queries that produced the best estimates for prior seasons. We then left it to perform through the new season and evaluated it at the end. It didn’t use the official CDC data for estimation during the season—only in the initial training.

In the 2012/2013 season, we significantly overpredicted compared to the CDC’s reported U.S. flu levels. We investigated and in the 2013/2014 season launched a retrained model (still using the original method). It performed within the historic range, but we wondered: could we do even better? Could we improve the accuracy significantly with a more robust model that learns continuously from official flu data?

So for the 2014/2015 season, we’re launching a new Flu Trends model in the U.S. that—like many of the best performing methods [1, 2, 3] in the literature—takes official CDC flu data into account as the flu season progresses. We’ll publish the details in a technical paper soon. We look forward to seeing how the new model performs in 2014/2015 and whether this method could be extended to other countries.

As we’ve said since 2009, "This system is not designed to be a replacement for traditional surveillance networks or supplant the need for laboratory-based diagnoses and surveillance." But we do hope it can help alert health professionals to outbreaks early, and in areas without traditional monitoring, and give us all better odds against the flu.

Stay healthy this season!
Read More..